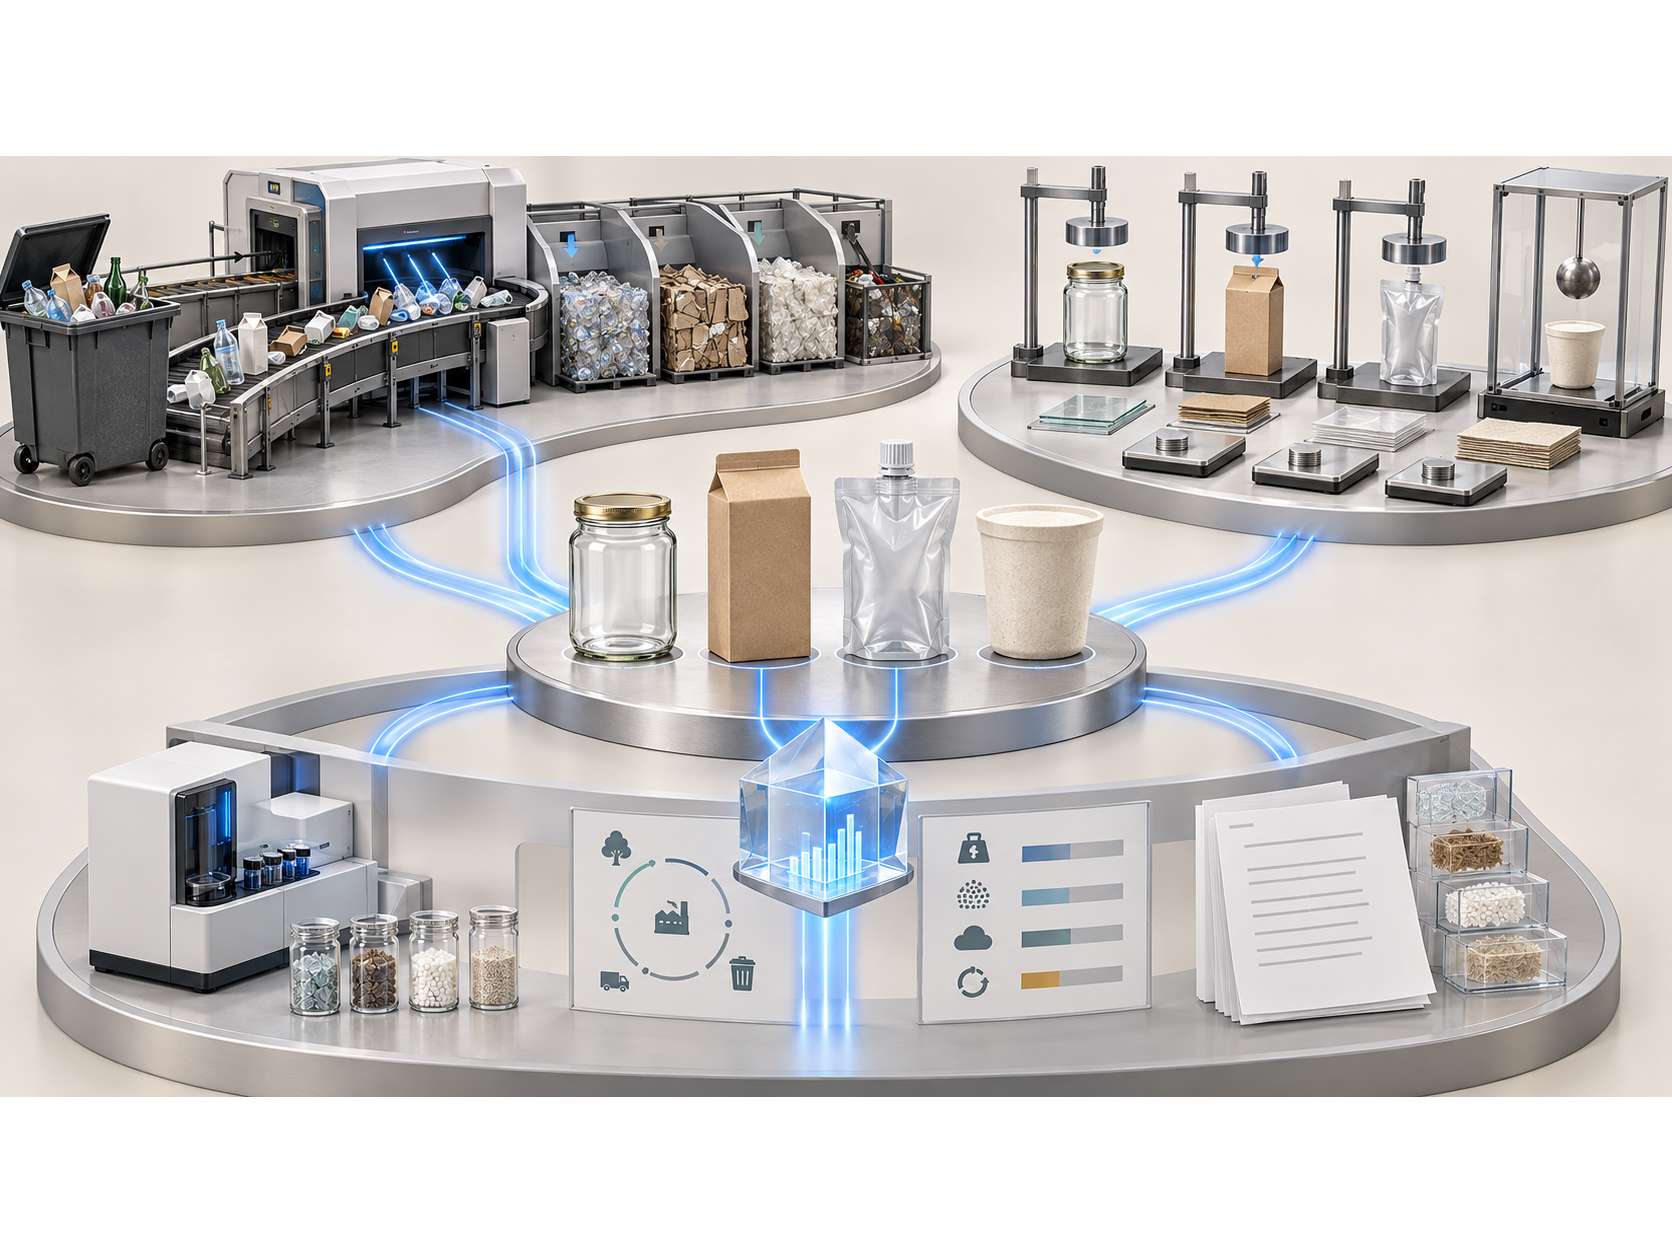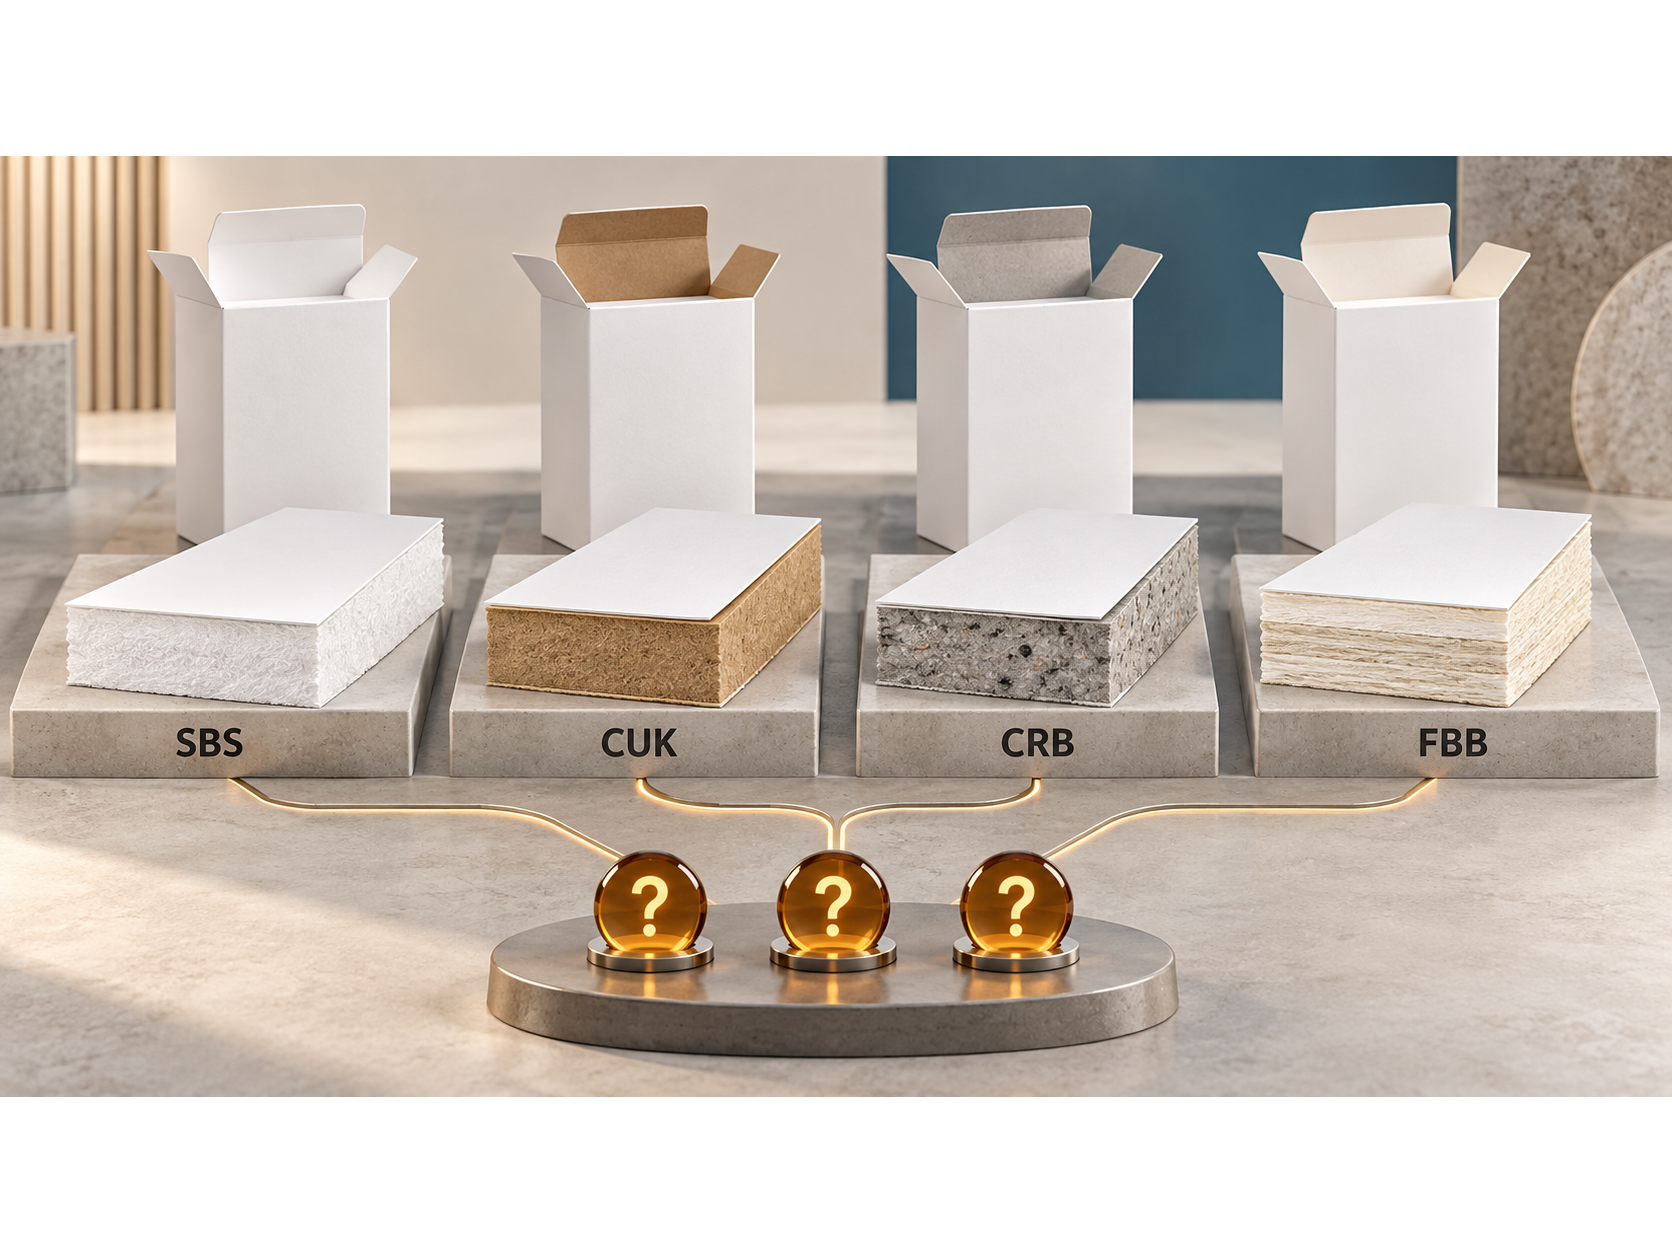
Most sustainable packaging projects begin with a material swap. Plastic to paper, virgin to recycled, conventional to compostable. The swap is visible, it photographs well, and it gives marketing a claim to work with.
The evidence suggests the sequence is backwards. For U.S. CPG brands, the interventions that move the most are usually structural and logistical, and for one large category of products the highest-impact solution is packaging that protects better rather than packaging that weighs less.
This piece sorts the available solutions into four tiers and identifies where each stops working.

Tier one: remove a component
The cheapest intervention is the one that eliminates a purchase order line.
Every component has to be sourced, received, counted, stored, and assembled, and each of those steps costs money before the component does anything environmental. The candidates worth auditing first are secondary layers that duplicate a function of the primary pack, void fill that exists because the box is oversized, and separate inserts that could be die-cut from the same board as the box.
Constraint: a component that looks decorative is often doing retention work. Validate any removal with product loaded, not with an empty sample.
Tier two: reduce the cube
For brands shipping parcels, this is the highest-return intervention available.
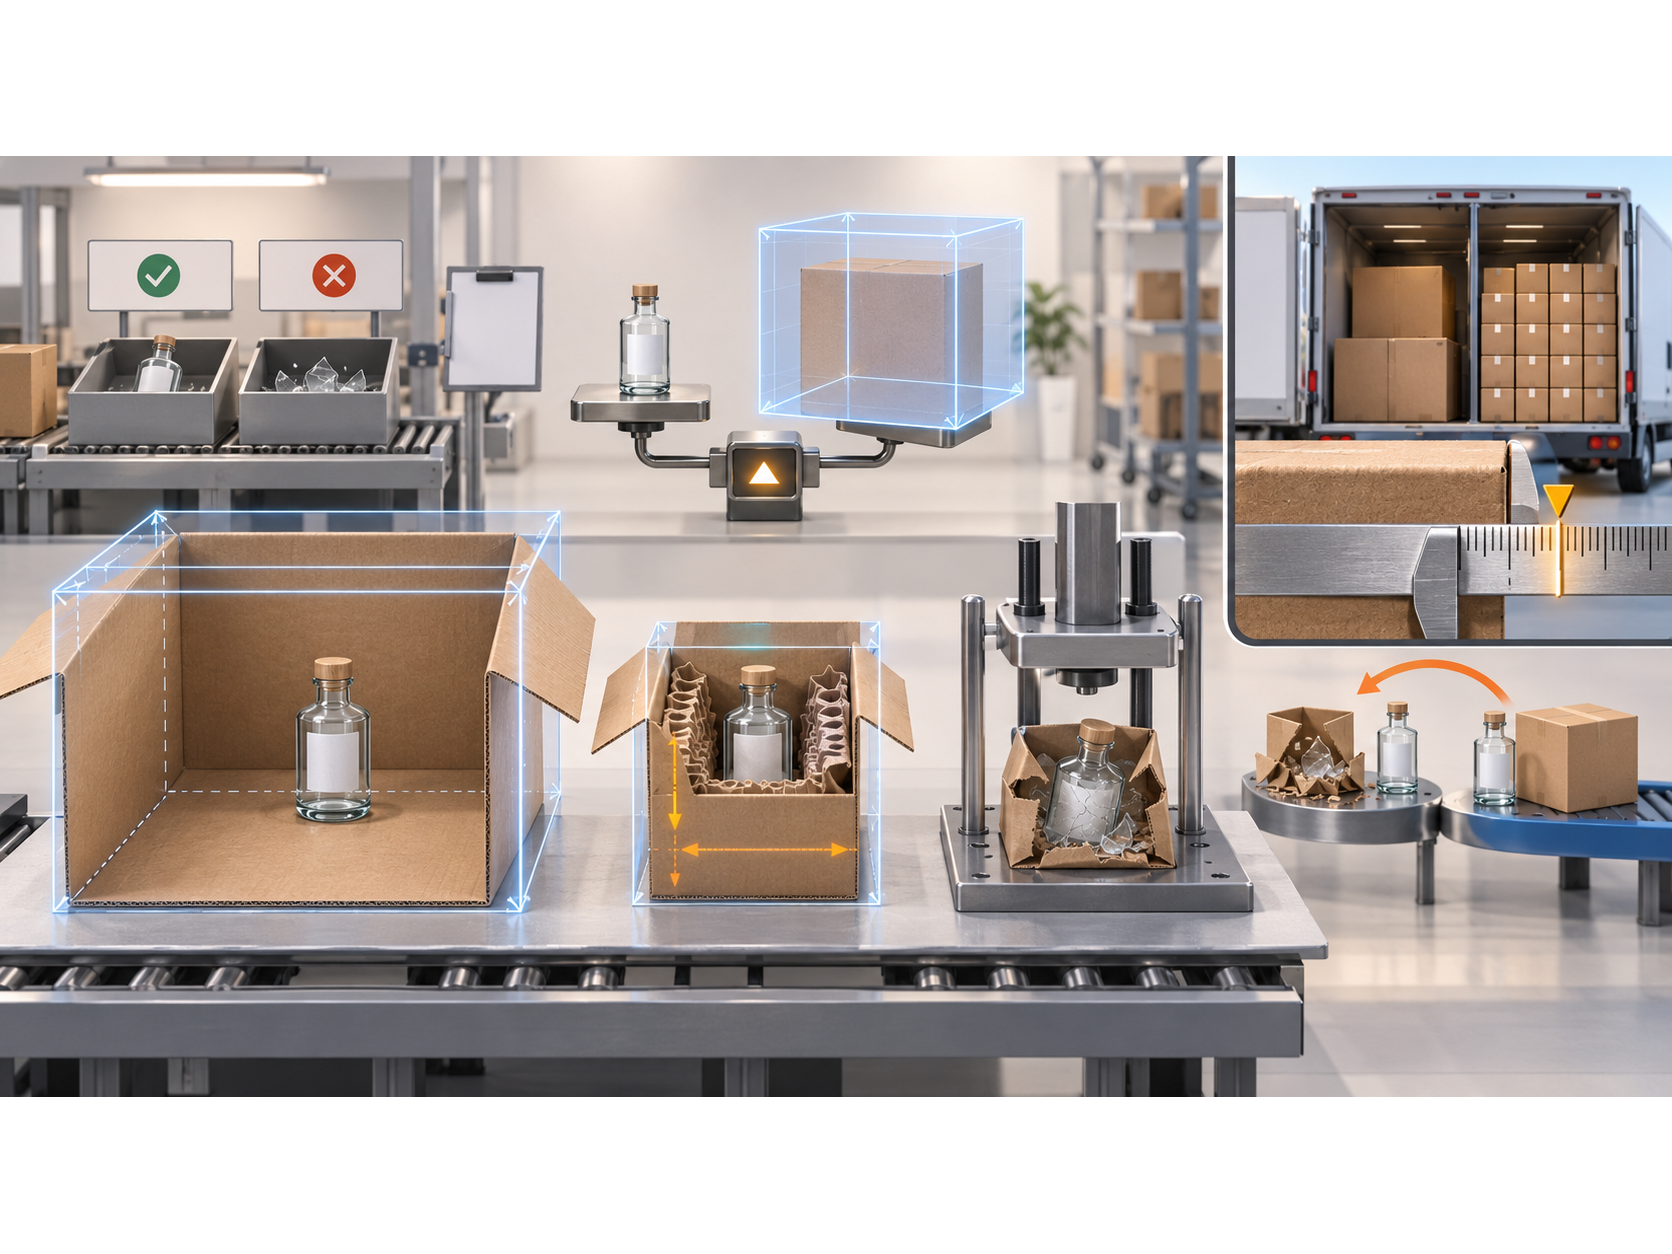
U.S. carriers bill on the greater of actual weight or dimensional weight, and dimensional weight is calculated from the box rather than the contents. FedEx's domestic divisor is 139, so a box's length, width, and height in inches multiplied together and divided by 139 produces the billable weight in pounds when it exceeds the scale weight.
Two mechanics make this worth attacking. The formula is multiplicative, so trimming two dimensions by 10 percent each reduces billable volume by roughly 19 percent. And effective August 18, 2025, FedEx began rounding every fractional inch up to the next whole inch before calculating, with UPS adopting the same rule the same day. A box measuring 11.1 inches now bills as 12.
Reported savings from right-sizing to within one to two inches of product dimensions cluster in the 15 to 30 percent range on carrier spend, with the upper end applying to lightweight products currently shipping in oversized boxes. These figures come from fulfillment providers rather than from carriers or peer-reviewed work, so treat the range as directional.
Constraint: the saving is freight, and the risk is damage. A box trimmed past the protection threshold converts a freight reduction into a replacement product, a replacement package, and a second shipment. Establish a damage and replacement baseline before changing anything.
Tier three: design for recovery
This tier moved from voluntary to enforceable in 2026, which is why it now sits above material choice rather than below it.
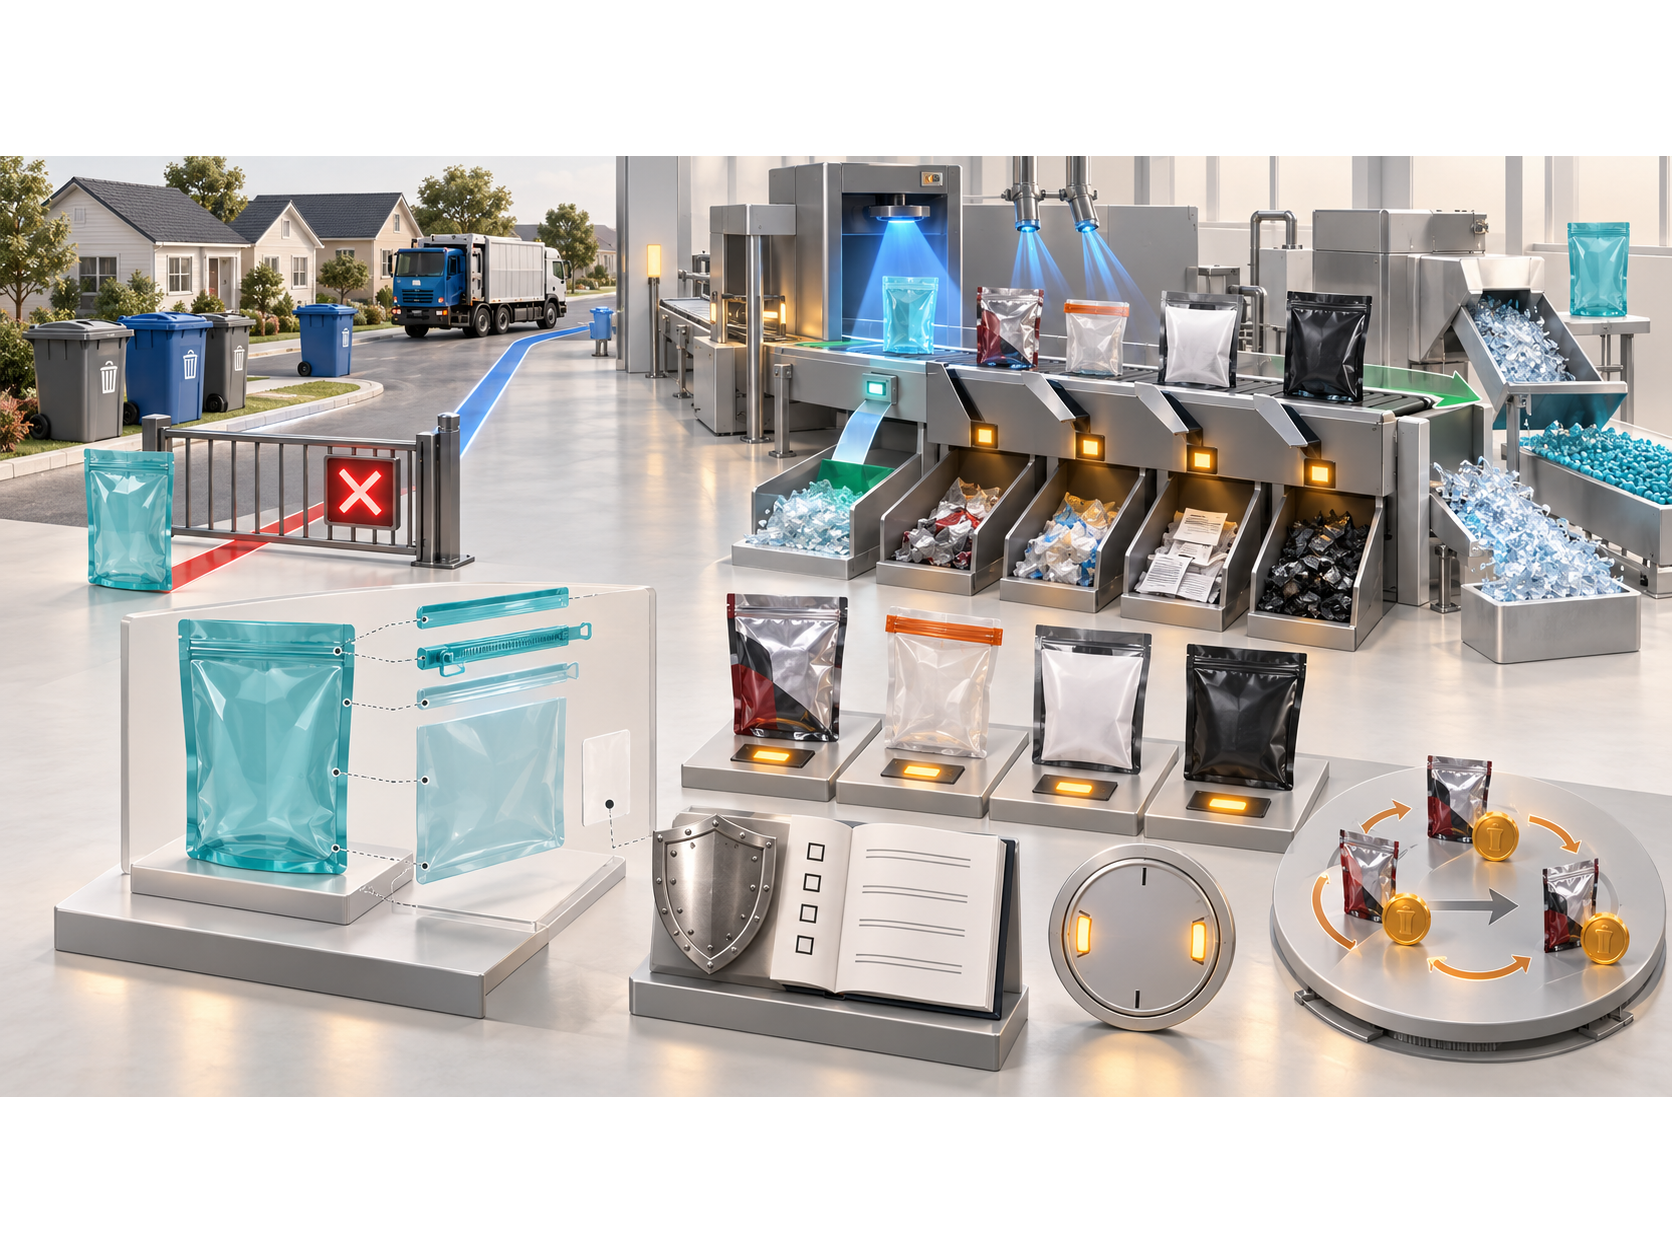
Recyclability requires two independent conditions. The package has to be designed so recycling infrastructure can process it, and consumers have to have access to collection that accepts it. Failing either one means the package is not recyclable regardless of what it is made from.
The design condition now has a legal test in the largest U.S. state market. The APR Design Guide for Plastics Recyclability, maintained by the Association of Plastic Recyclers since 1994 and developed through technical committees that include reclaimers, classifies each design feature as preferred, detrimental to recycling, or rendering the package non-recyclable.
That second date converts recyclability from a labeling question into a recurring cost. A hard-to-recycle structure carries an eco-modulated fee for every year it stays in market.
APR moved to semiannual Guide updates in 2026, publishing on March 30 and September 30, which gives design teams a predictable revision window rather than rolling changes.
The moves inside this tier are specific: keeping flexible structures within one polymer family so they stay in one stream, checking that closures and liners share that family, and avoiding label constructions and pigments that defeat optical sorting.

Tier four: substitute the material
Material substitution works. It works last, after the three tiers above have addressed what substitution cannot reach.
Recycled content is increasingly mandatory rather than optional across several states, which makes it a procurement commitment as much as a design decision. Fiber replacing plastic works where barrier is not load-bearing. Certified compostable performs in closed-loop settings with organics collection and depends entirely on consumer access in open retail distribution.
The arithmetic is why it ranks fourth. A recycled-content package that is 40 percent larger than necessary still ships 40 percent more air, and a recycled-content package with an incompatible closure still fails at the sorting line.
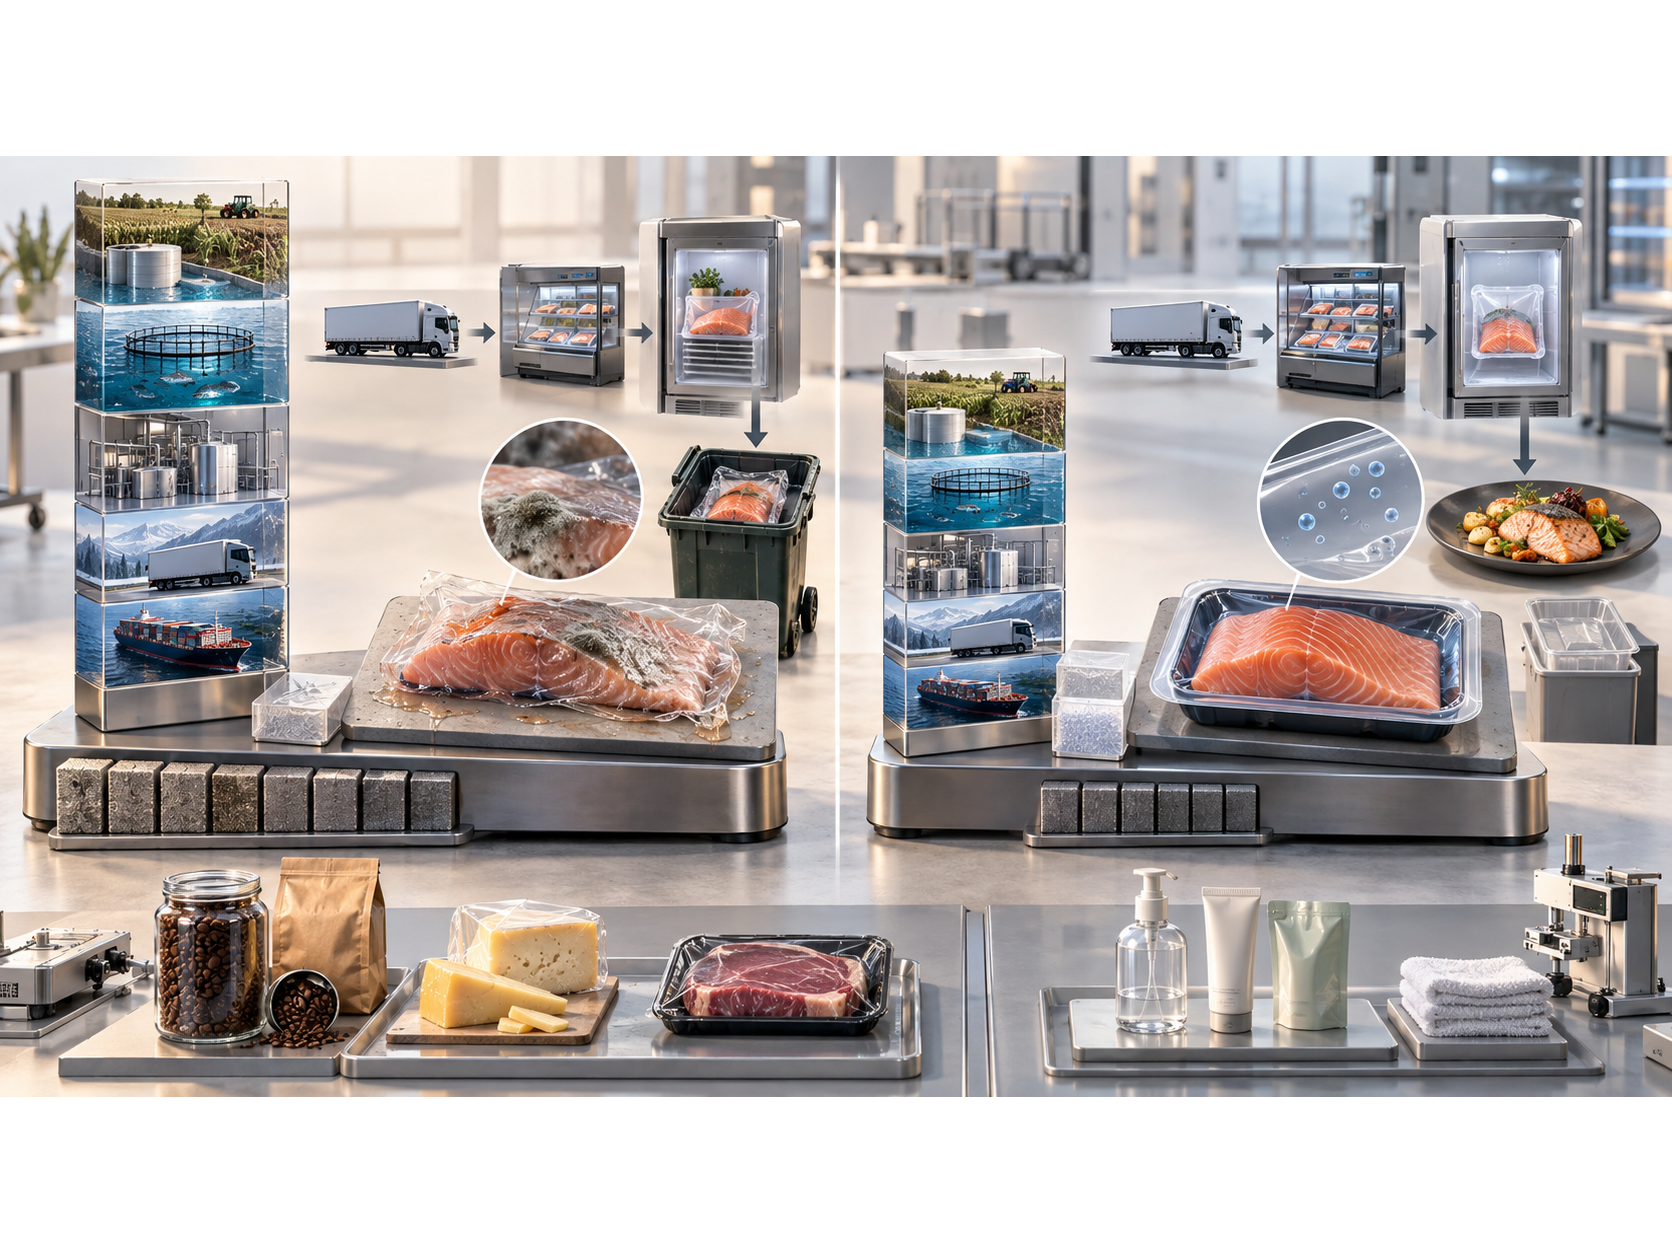
The counterpoint: when more packaging is the better answer
For food products, packaging is rarely the dominant environmental cost, and the standard sustainability instinct can produce the wrong result.
A review of life cycle assessments across milk, yogurt, fish, fruit, meat, and grain found packaging contributed at most 25 percent of global warming potential and 35 percent of energy consumption across those systems.
The ratio between product impact and packaging impact varies by orders of magnitude and determines which direction to optimize. Research from the University of Michigan's Center for Sustainable Systems mapped that ratio across the food LCA literature and found it ranges from 0.06 in a wine example to 780 in a beef example, with high ratios in cereals, dairy, seafood, and meat indicating greater opportunity to cut total impact through packaging that reduces food waste.
One published meat study illustrates the magnitude. Extending shelf life from 6 to 15 days using a modified atmosphere reduced food waste from 47 percent to 15 percent of production and cut climate change impact by approximately 78 percent, a result that held regardless of material type or packaging-to-food ratio.
Interpretation: for a product that is expensive to produce relative to its packaging, a heavier package that extends shelf life can lower total system impact even though the packaging footprint rises. For a product that is cheap to produce relative to its packaging, the conventional logic of reducing packaging holds.
Recommendation: establish which side of that ratio your category sits on before evaluating any material change. Coffee, cheese, and protein sit on one side. Many household and personal care products sit on the other.
The four tiers compared
Tier | Primary effect | Typical implementation | Where it stops working |
|---|---|---|---|
Remove a component | Lower unit and handling cost | Weeks, plus a loaded sample test | The component was doing retention or presentation work |
Reduce the cube | 15–30% reported freight reduction | One dieline cycle plus tooling | Trimming raises damage above the freight saved |
Design for recovery | Avoids SB 54 fee exposure, enables claims | A full structural cycle | Barrier requirements exceed what a recyclable structure delivers |
Substitute the material | Meets mandates, enables claims | Depends on supply contracting | The structure or size was the actual problem |
What this means for CPG leaders
Sequence matters more than ambition. Auditing components and cube before touching materials usually produces a larger reduction at a lower cost, and it does not require a supply chain change.
The California dates create a near-term planning requirement independent of sustainability goals. Any plastic package carrying a recyclability claim needs an APR Design Guide assessment ahead of October 4, 2026, and any package sold into California needs a view of its eco-modulated fee exposure ahead of January 1, 2027.
For food categories with high production impact relative to packaging impact, shelf life extension deserves evaluation alongside lightweighting rather than after it. The two can point in opposite directions, and the LCA evidence indicates the shelf-life path can dominate.
Finally, every tier requires a loaded test. ASTM D4169 covers distribution testing of shipping units, and the qualifying condition in that standard is that the unit is loaded. A specification that passes on paper is not evidence.