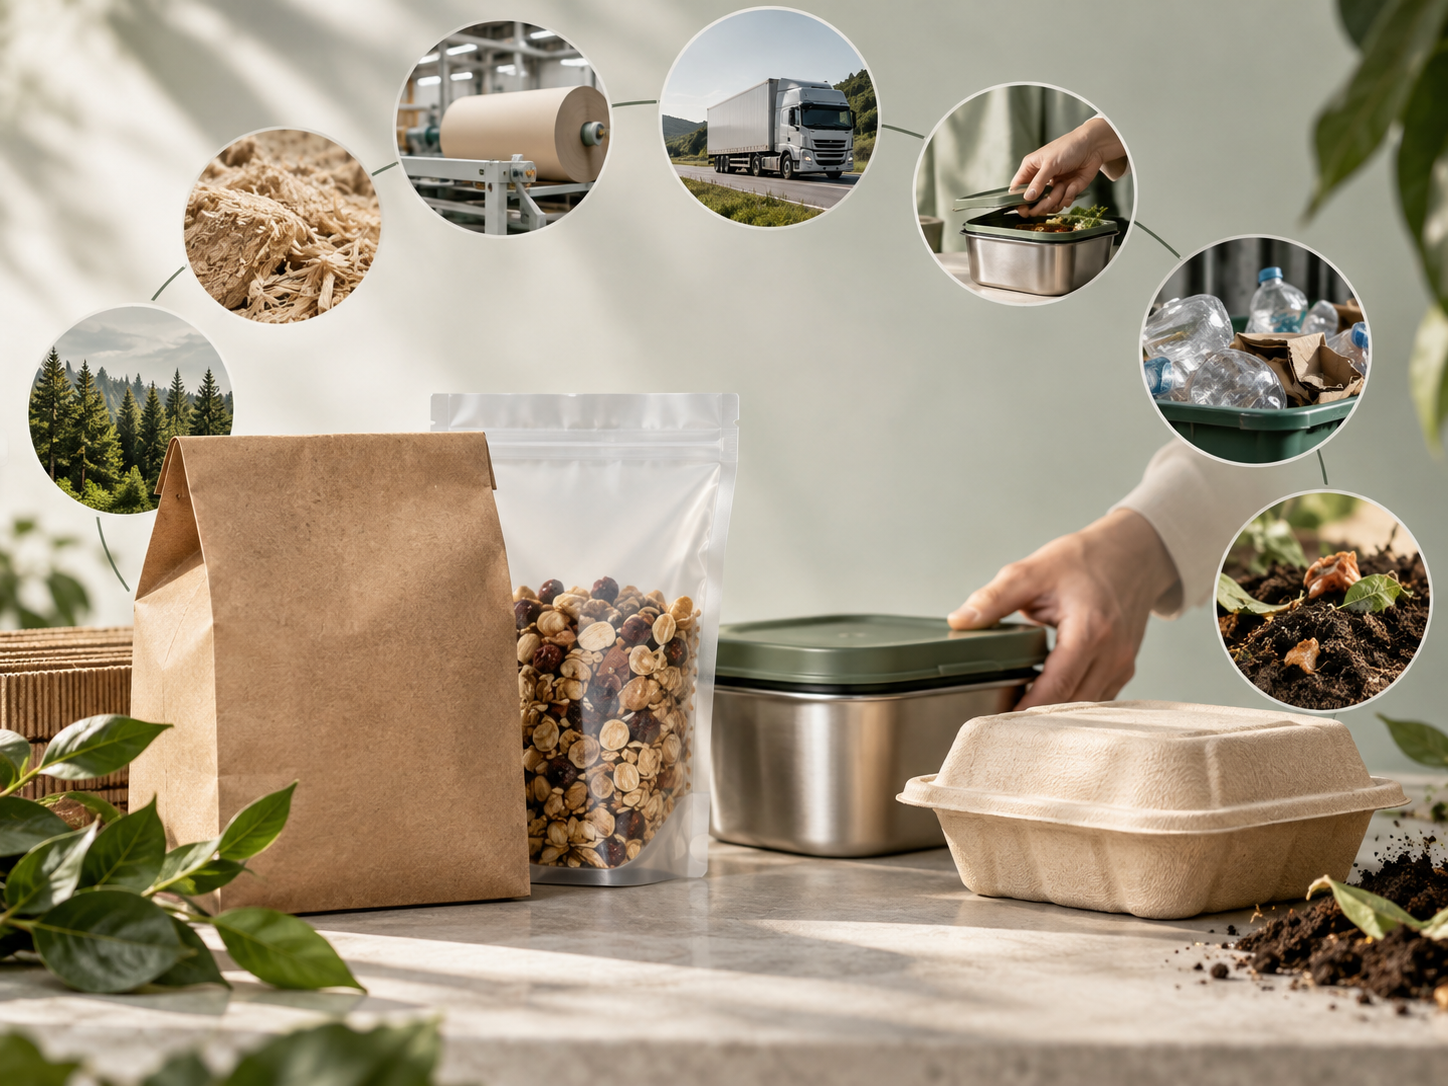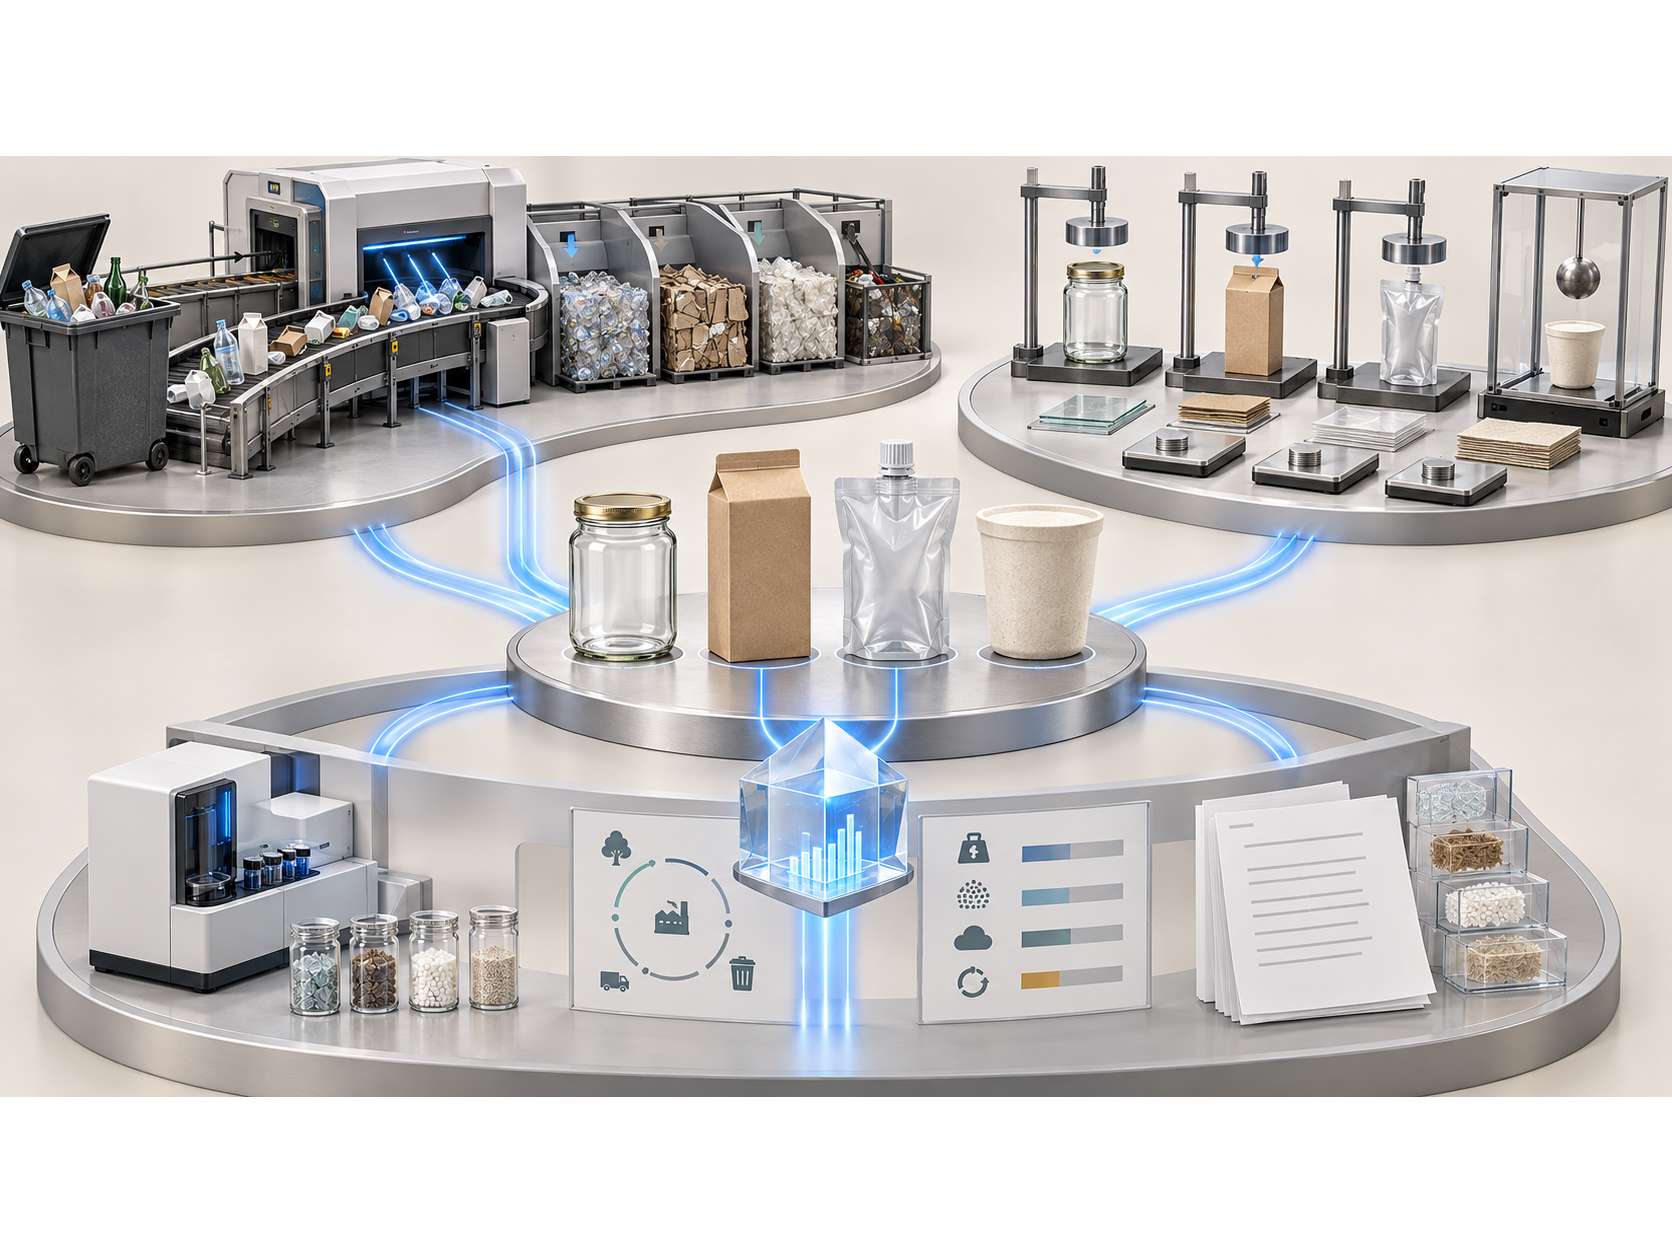
Ask which packaging material is most sustainable and most answers arrive as a ranking: glass and paper near the top, plastic near the bottom, bioplastic somewhere above everything. The ranking feels intuitive. Most of the evidence points elsewhere.
A material's environmental performance depends less on its name than on three measurable properties: how much of it gets recovered in practice, how much of it a package needs to do its job, and what a claim about it actually measures. Judged on those three, several of the most popular material swaps lose ground.
This guide applies each test to the common U.S. packaging materials.
Test One: How Much Is Actually Recovered
Recyclable in principle and recovered in practice are two different numbers, and the gap between them varies widely by material and format.
The most recent national figures come from EPA's 2018 containers and packaging data:
Material and format | Share recovered for recycling, 2018 |
|---|---|
Corrugated boxes | 96.50% |
Steel containers and packaging | 73.80% |
Aluminum beer and soft drink cans | 50.40% |
Aluminum containers and packaging, all formats | 34.90% |
Glass containers | 31.30% |
HDPE natural bottles | 29.30% |
PET bottles and jars | 29.10% |
Paper packaging, excluding corrugated | 20.80% |
Plastic containers and packaging, all formats | 13.60% |
Polystyrene containers and packaging | 3.60% |
Three caveats apply. The data are from 2018, which remains EPA's most recent national release. EPA measures material collected for recycling and does not track what happens afterward, including exports or loads later rejected for contamination. And the averages hide format differences: aluminum cans recover at 50.4 percent while aluminum overall, including foil and food trays, recovers at 34.9 percent.
The practical reading is that format matters as much as material. A PET bottle and a PET clamshell share a polymer and have different recovery outcomes. A corrugated shipper and a coated paperboard carton are both paper and sit at opposite ends of the table.
Test Two: How Much Material the Job Requires
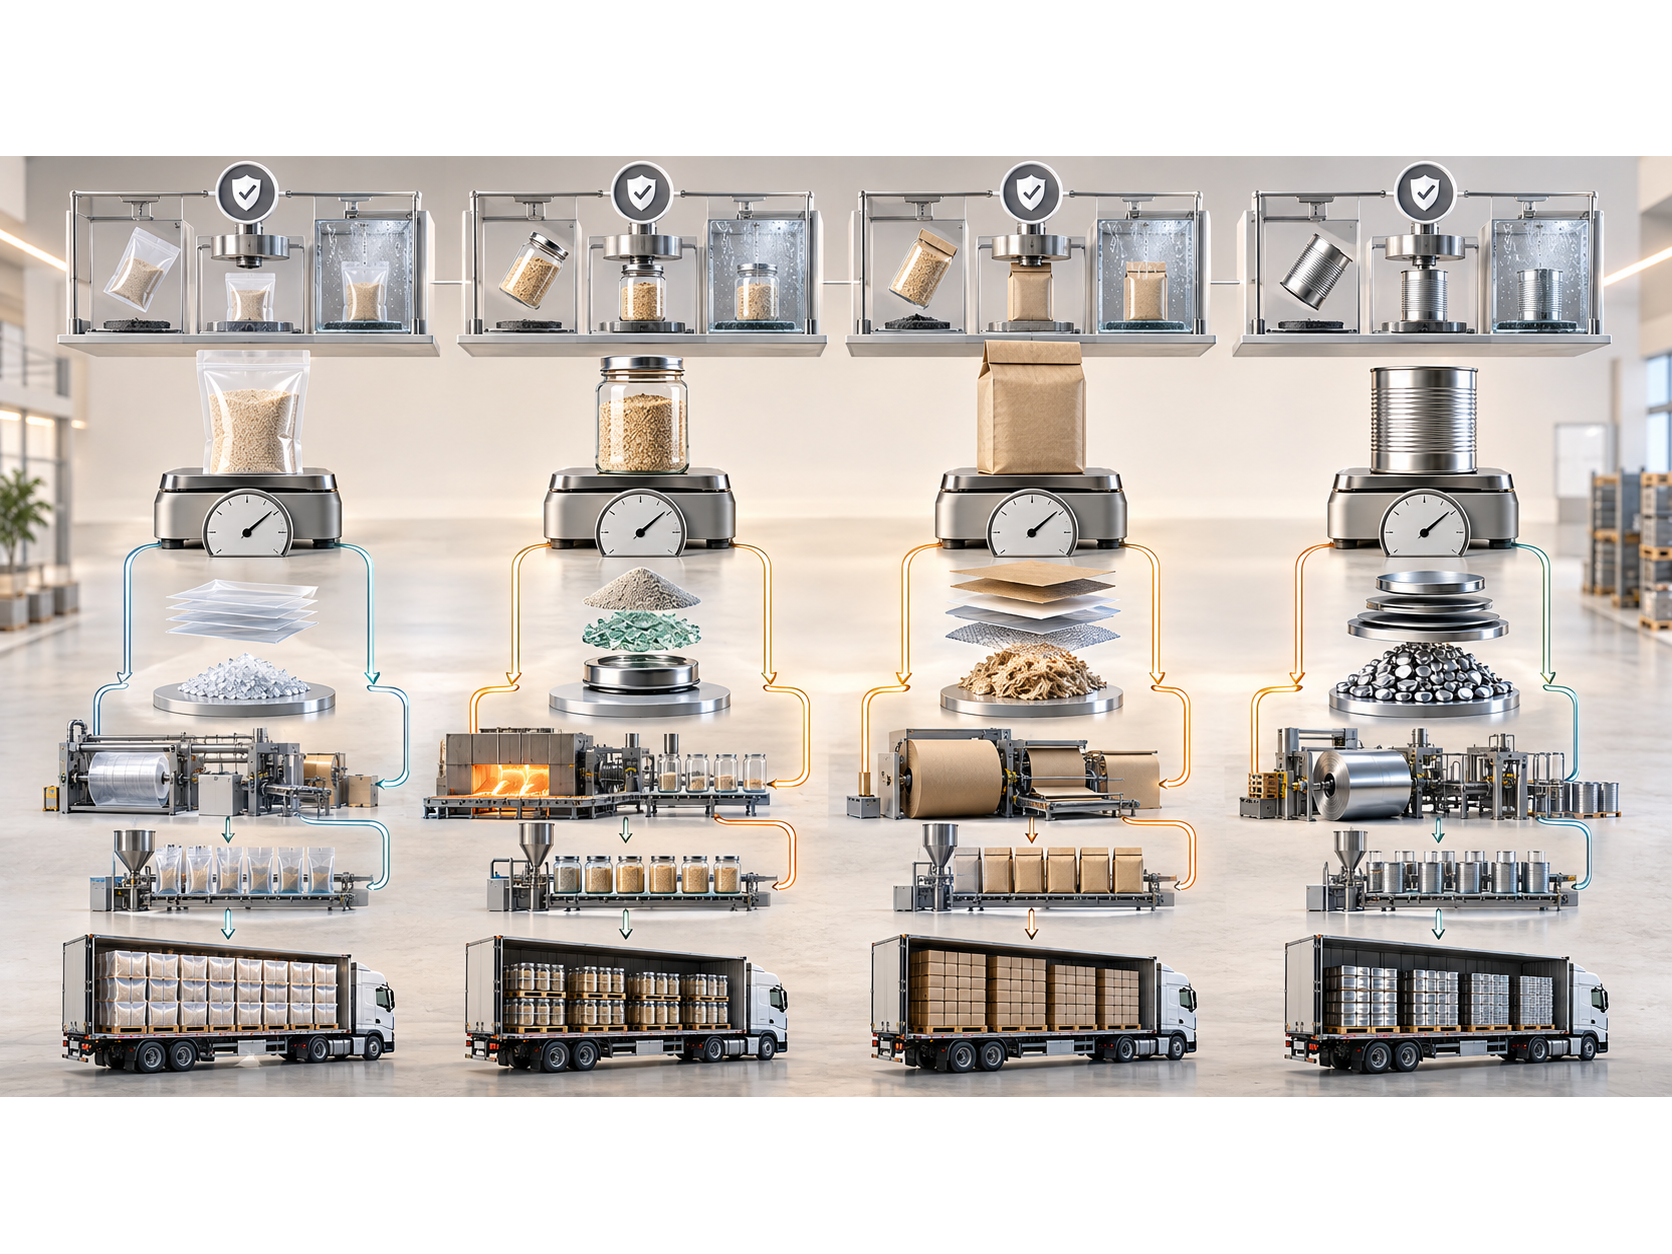
Weight drives most of a package's production and transport footprint, and it is where material swaps most often backfire.
A peer-reviewed study in Environmental Science & Technology compared plastic products against their alternatives across 16 applications in packaging, construction, automotive, textiles, and consumer durables. In 15 of the 16, the plastic product produced fewer greenhouse gas emissions, by 10 to 90 percent across the life cycle, and the authors noted that for some food packaging applications no suitable alternative exists.
A separate U.S.-focused assessment, published in Science of the Total Environment by researchers including Michigan State University's School of Packaging, found polyethylene packaging averaged roughly 70 percent lower life cycle global warming potential than a mix of commonly used U.S. alternatives including paper, glass, aluminum, and steel.
The mechanism is mass. An alternative that needs more material per unit of protection carries that extra weight through manufacturing, filling, and every mile of distribution. A glass jar can post a respectable recovery rate and still carry a larger footprint than a pouch doing the same job, because the jar is heavier from the moment it leaves the furnace.
Test Three: What the Claim Actually Measures
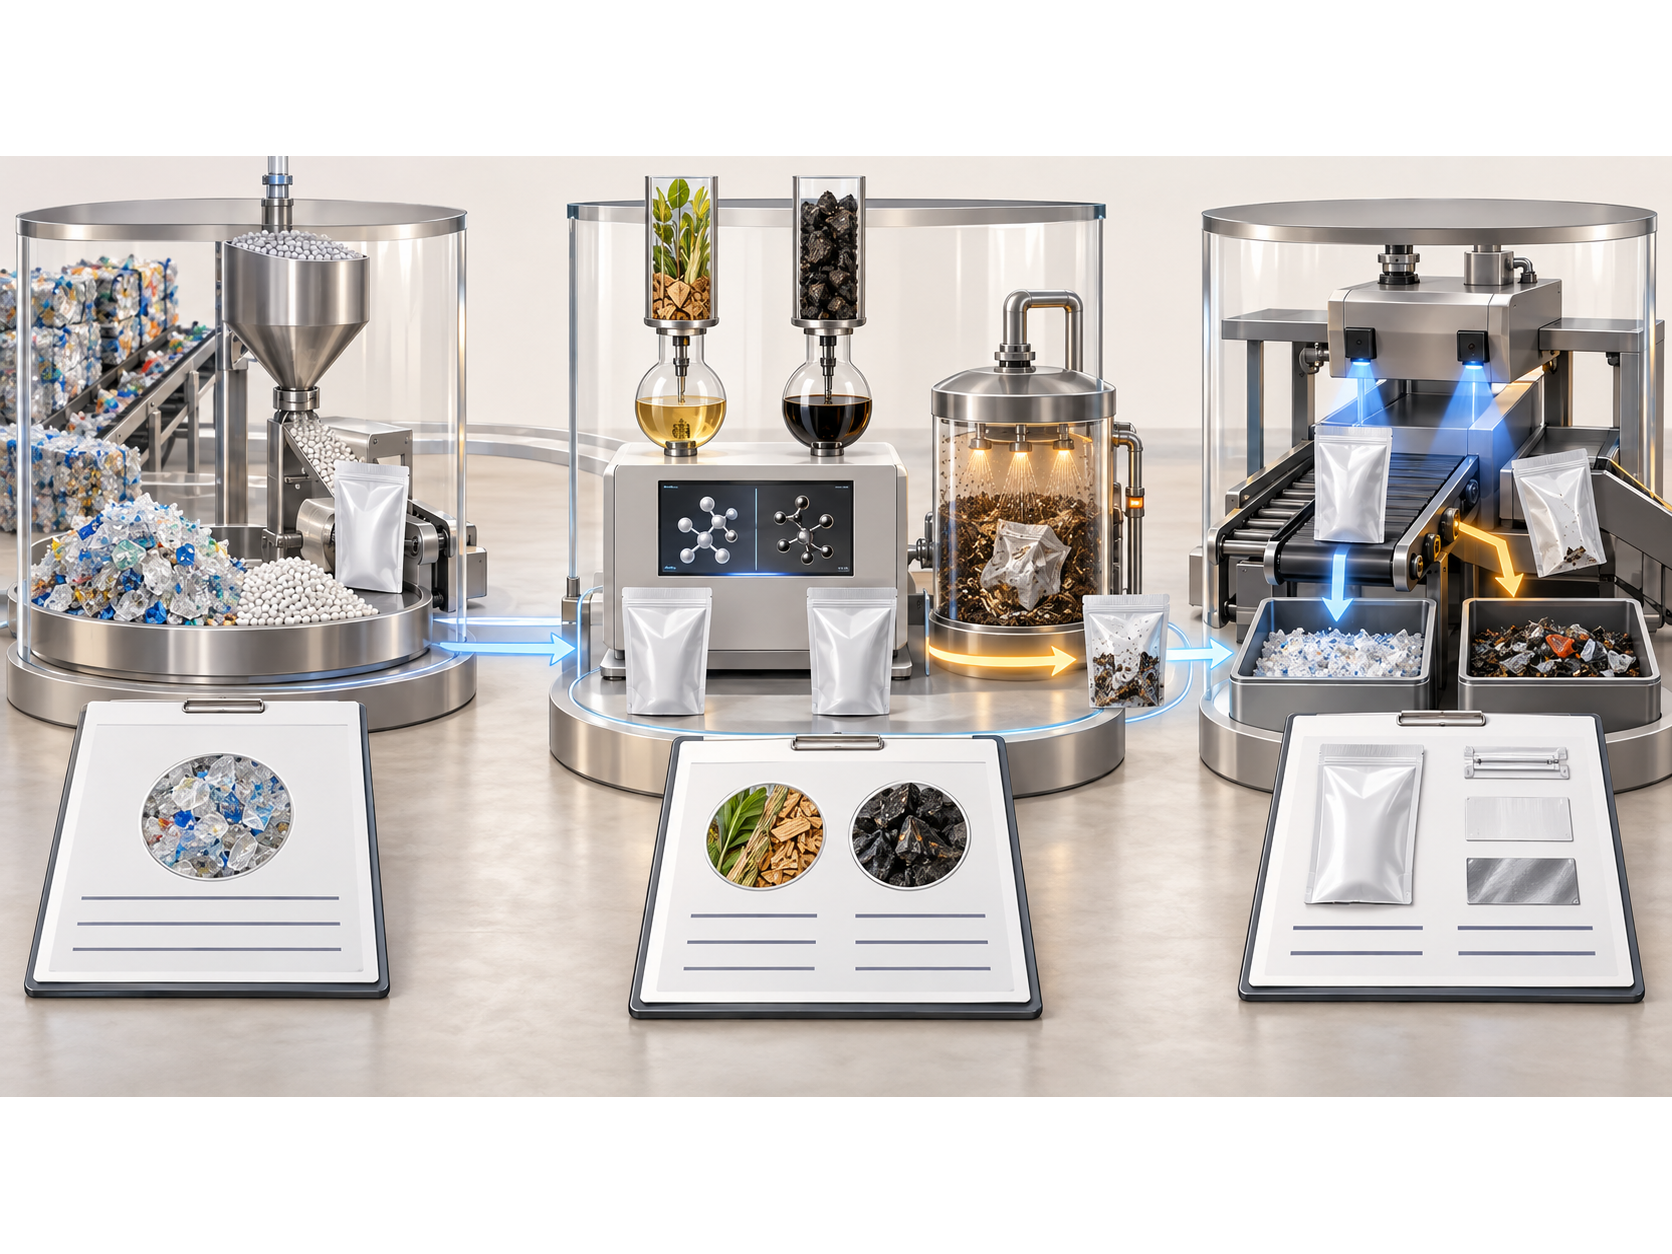
Material claims describe three different stages of a package's life, and they get confused constantly.
Recycled content describes where the material came from. Recyclable describes where the finished package can go afterward. Bio-based describes the source of the carbon.
That last one has a precise U.S. definition. The USDA BioPreferred Program defines biobased content as the ratio of new organic carbon to total organic carbon, measured by radiocarbon analysis under ASTM D6866. It measures origin and nothing else.
That distinction has consequences. Washington's Department of Ecology states plainly that BioPreferred status refers only to biobased content and does not mean an item is biodegradable or compostable, and that some fully compostable plastics are made from fossil materials. Whether a material composts depends on its chemistry, not its feedstock.
Applied to a real specification, this means a bio-based polyethylene carries a renewable-carbon claim while behaving like polyethylene at end of life. It goes into the same recovery stream as conventional PE and does not compost. A plant-based label on a package says something true about the input and nothing about the output.
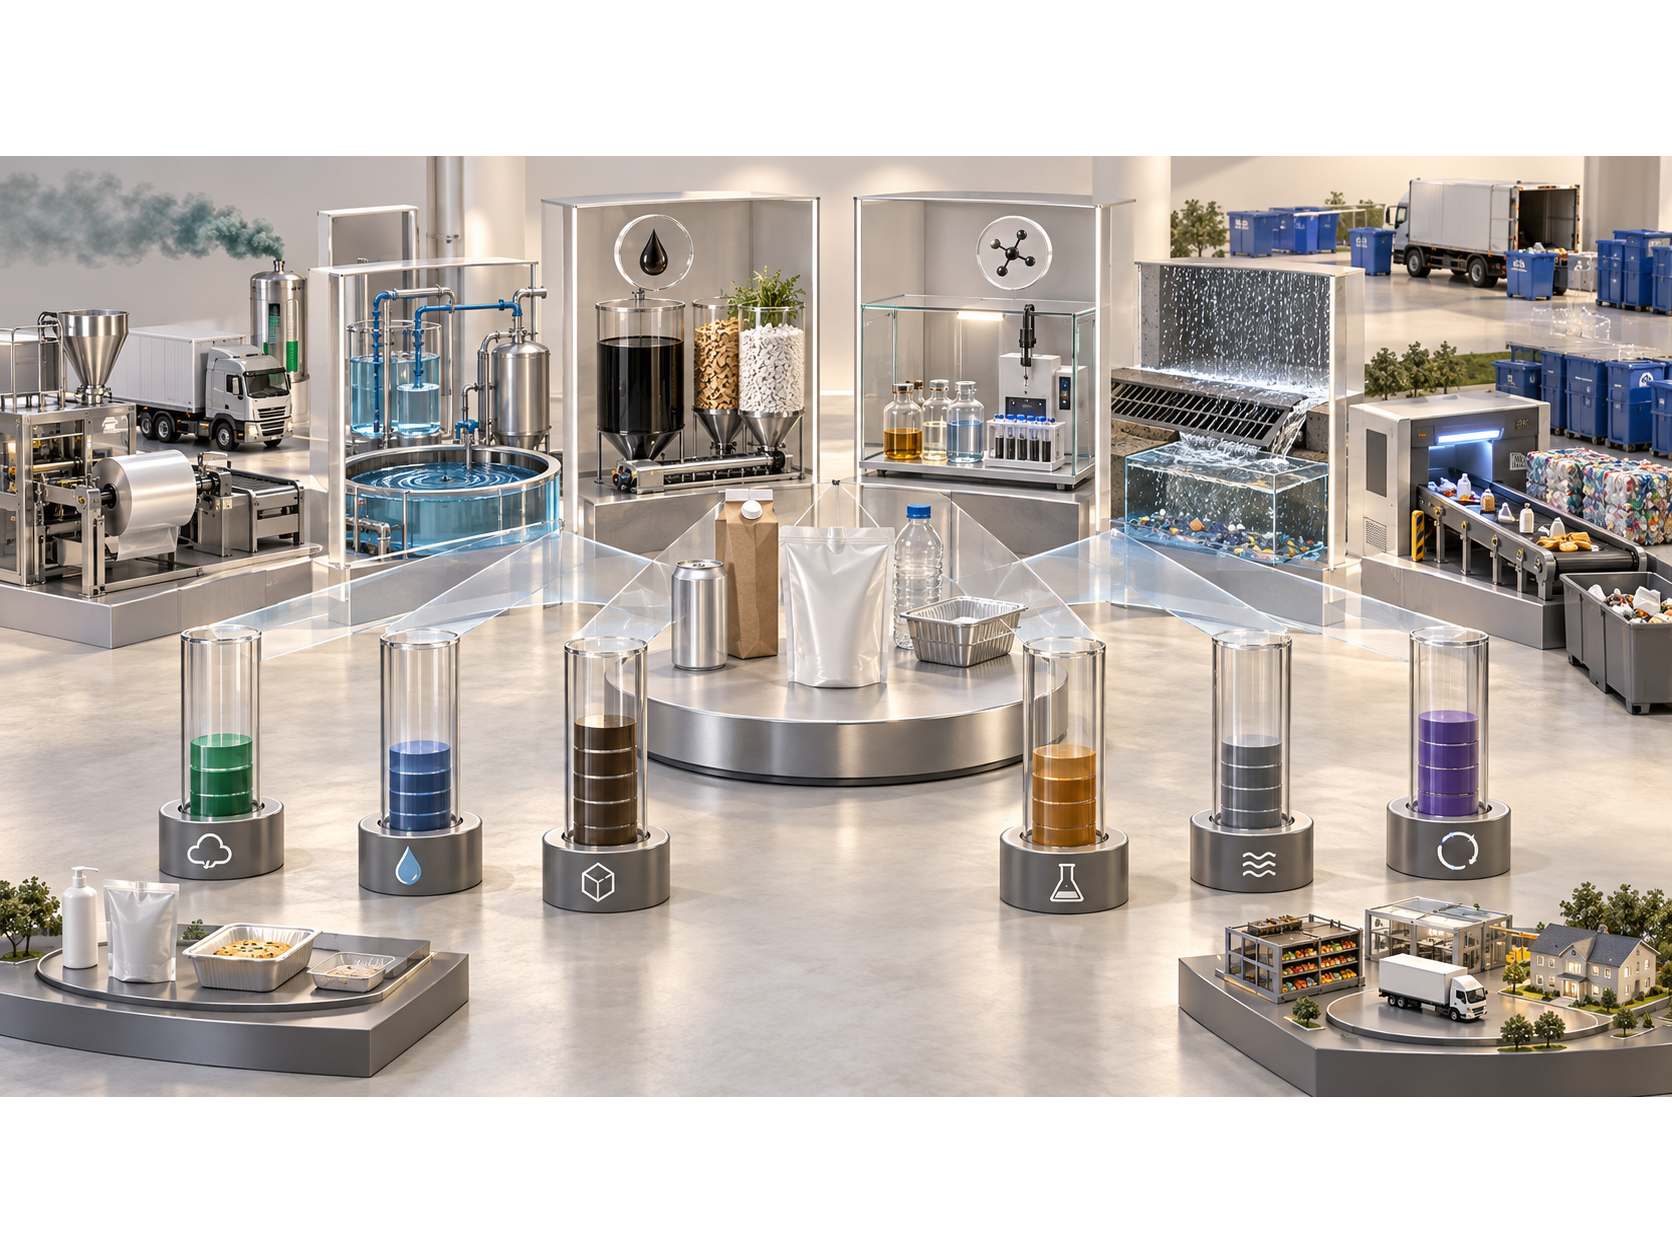
The Constraint: Carbon Is One Impact Among Several
The life cycle studies above measure climate impact and, in the Michigan State case, resource use and water scarcity. They do not settle every question that makes material choice contentious.
The same Environmental Science & Technology paper opens by listing plastics' other concerns: fossil feedstock, potential toxicity, and leakage into the environment. Greenhouse gas accounting does not capture what happens to material that escapes collection, and the recovery table above shows plastic packaging as a whole had the lowest recovery rate of any major material group except polystyrene.
Recovery rates also move. The 2018 figures predate the state extended producer responsibility programs now funding collection infrastructure, so a material's recovery position today is a snapshot rather than a fixed property.
A defensible reading holds both findings at once. Lighter materials usually win on carbon. Materials with poor recovery carry a separate environmental cost that carbon accounting leaves out. The right choice depends on which risk your product, market, and distribution actually present.
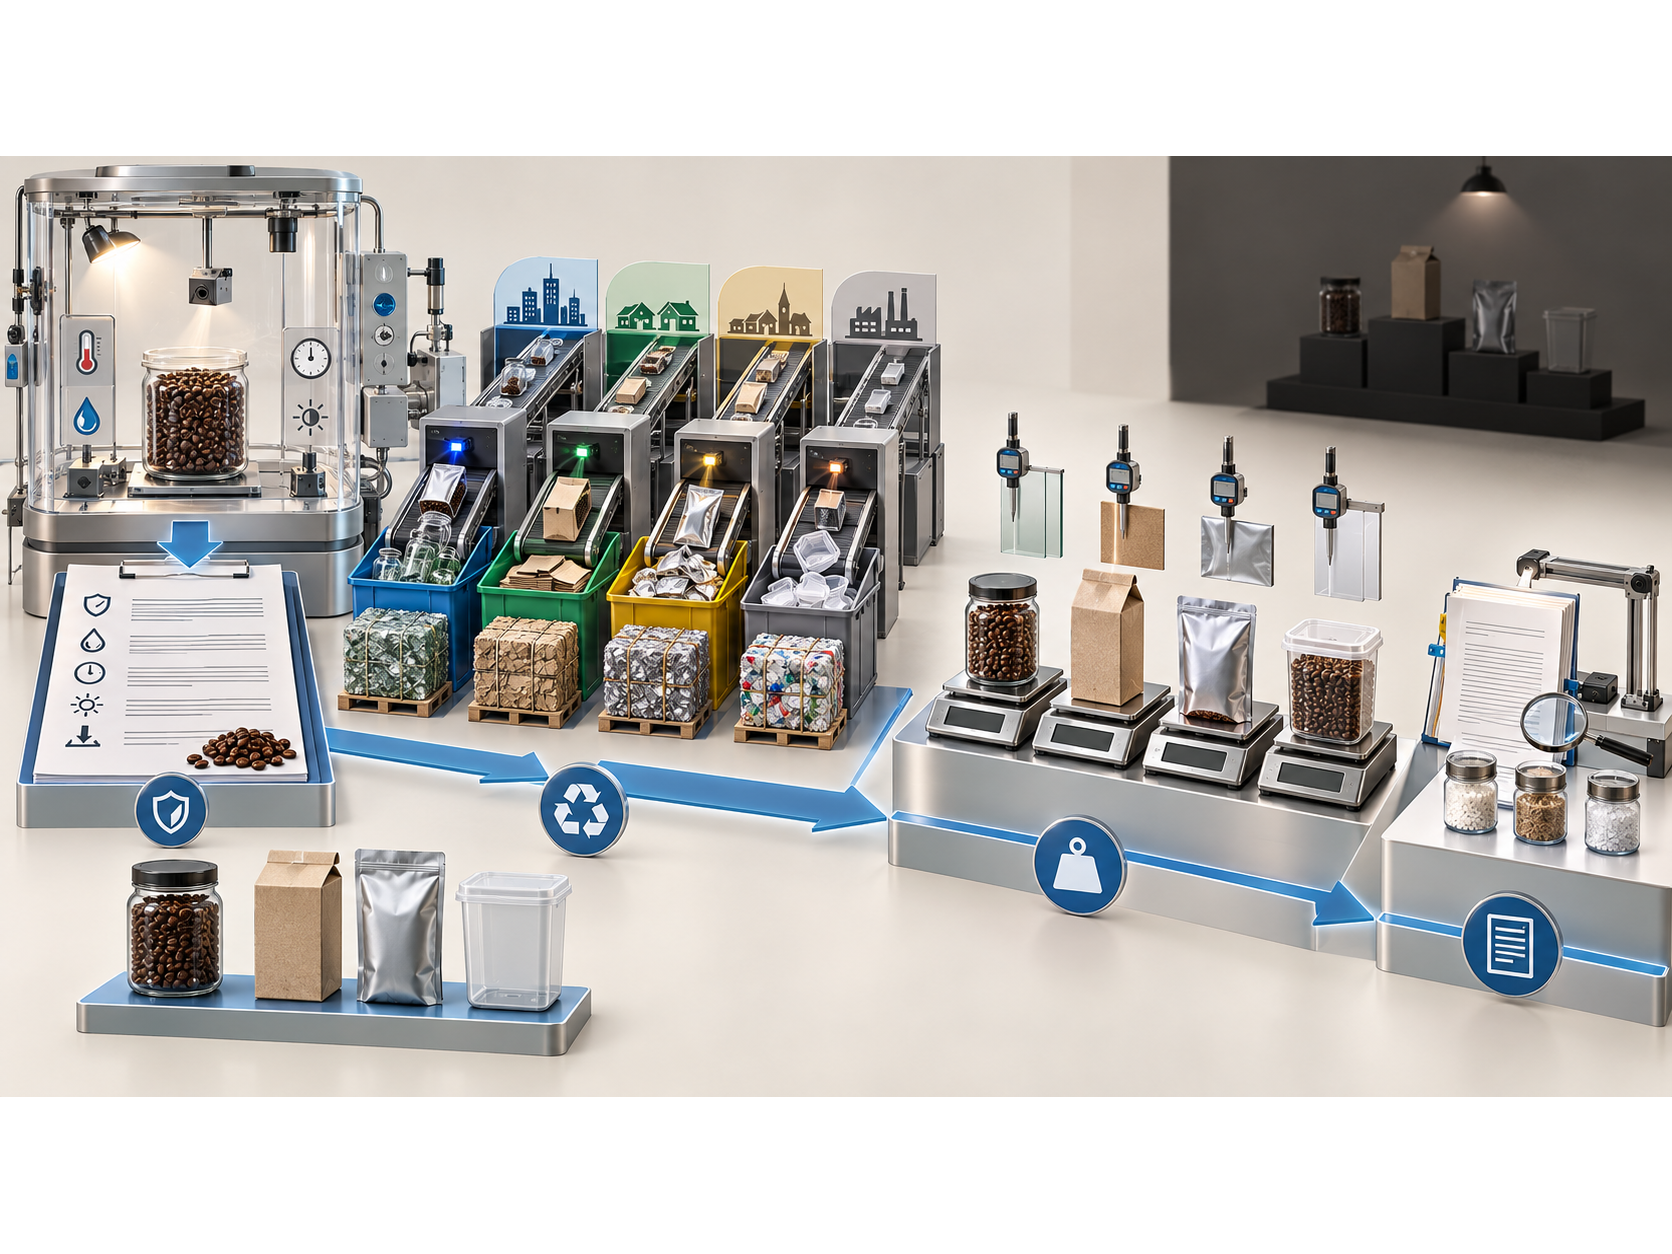
Start From the Package Specification
Material rankings are a shortcut that skips the three questions that decide the outcome. The order that holds up runs the other way: define what the product needs in protection and shelf life, check which formats are actually recovered in the markets where you sell, compare the options on mass per job, and only then read the claims each material allows.
That sequence rarely produces the answer the ranking predicted. It does produce one you can defend.
What This Means for CPG Leaders
Format matters as much as material. The same material can sit at opposite ends of the recovery table depending on whether it becomes a bottle, a tray, a carton, or a film, so evaluate the specific format rather than the material family.
Run the weight comparison before approving a material swap. Peer-reviewed life cycle work consistently finds that lighter materials win on carbon in most applications, and moving to a heavier material can raise total footprint even when that material recovers better.
Keep the three claim types separate. Recycled content, recyclable, and bio-based describe source, destination, and carbon origin respectively, and none substitutes for another. A plant-based package is not a compostable one, and the panel copy has to reflect that.
Treat carbon as one input. For formats with poor recovery, the risk of material escaping collection is a separate cost that carbon accounting does not capture, and it deserves its own line in the decision.